Specifying Images in the Data
Description
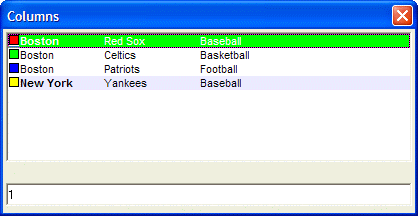
We have seen how the embedded owner-draw directives can control the font, color and background color of the data. In this lesson, we will show how you can specify bitmaps in the data that you display. The directive for specifying an image is:
{I:'imagename'}In the following example we start each row with an image.
tab1 = "{T=1}"
tab2 = "{T=2}"
font2 = "{F=Arial,8,B}"
font1 = "{F=Arial,8}"
rowcolor1 = "{B=Blue White,Green}"
rowcolor2 = "{C=Black,White}"
image1 = "{I:'a5_color_red'}"
image2 = "{I:'a5_color_bright_green'}"
image3 = "{I:'a5_color_blue'}"
image4 = "{I:'a5_color_yellow'}"
dim data_selected as N
data_selected = 1
data =  image1+rowcolor1+font2+"Boston"+font1+tab1 + "Red Sox"+tab2+"Baseball" + crlf()+\
       image2+"Boston"+tab1+"Celtics"+tab2+"Basketball" + crlf()+\
       image3+"Boston"+tab1+"Patriots"+tab2+"Football" + crlf()+\
       image4+rowcolor1+font2+"New York" + font1 +tab1 + "Yankees" +tab2+ "Baseball" + crlf()
ui_dlg_box("Columns",<<%dlg%
[%O={@@}%.80,10data_selected^#data];
{lf};
[.80data_selected];
%dlg%)
This script produces this dialog:
Limitations
Desktop applications only
See Also
